Sunday, July 25, 2021

PhD thesis

I defended my thesis in AI segmentation on 3D image data nearly 12 years ago. The thesis explores techniques to make a computer understand images of the heart and its vessels in 3D MRI and CT.  These were the days before deep learning, and the use of hand-crafted features to detect structures of interest in 3D was quite common. I must say I did not feel content with the techniques I had developed, as I knew all along the way I was using hand-crafted features based on observations that may not necessarily generalise to all different shapes and sizes. 

I went into areas in my domain during my postdoctoral years, and they were spent working at british image research centres where I explored different problems such as representing 3D objects of interest as 2D flat maps, and also tissue classification using machine learning. 

But I came back to my original PhD problem, in later years of my postdoc, and together with a very bright colleague, I was finally able to solve it using a deep neural net. I was somewhat content by then, as I was finally not hard-coding features or hand-crafting them, but the neural net was able to generalise by 'learning' features from training images. 

 In these years, I spent a lot of time doing two things mostly:  
  • Innovating, as my post was publicly and charity funded for making progress to improve our understanding of cardiac diseases using large-scale image analysis 
  • Giving back to the research AI community, by collecting images, curating them and sharing images with the community to train their AI models. 
 Here is a link to my PhD thesis

Friday, June 29, 2007

Intensity ridges

For the past two weeks I have been reading a lot. Starting off from the Manniseng PhD thesis to Frangi's vesselness filter to cubic B-spline sub-voxel interpolation, I have covered topics mostly that has got to do with measuring vesselness. Right now I am looking at three different approaches for automatically identifying the pulmonary veins of the left atrium:

1) A fuzzy approach where arteries and veins can be separated using local voxel affinity and range of other factors. The technique computes a range of affinities between every pair of voxel in the image. This is a combinatorilly explosive problem, but can be optimized using efficient data structures.

2) A level-set based approach: Arteries and veins can be "presumably" separated by labelling voxles according to the time-of-arrival of two evolving fronts which start off from a point in the artery and a point in the vein. Level-sets are a pain to implement as they must be solved via partial differential equations.

3) Computing intensity ridges. I was reading the paper by Aylward et. al. and it seems like it can be very useful in atleast detecting the starting points of the pulmonary veins (from the left atrium). The ridgeness function is loaded with Frangi's vesselness function which makes it detect tubular like objects such as vessels. The ridgeness should also be computed for every candidate voxel at an appropriate scale. I have also spent a considerable amount of time reading scale-spaces. A scale-space is the domain of images produced by convolving the image with a Gaussian filter at different variances (width). This 'optimal' scale is selected by choosing the variance (of the Gaussian) which gives the maximum response to Frangi's vesselness function.

I have also been implementing the intensity ridge functions. These include Hessian matrix comptutations, Eigen-space analysis of the Hessian and calculation of the ridgeness function. Although there were a few glitches in the program, these have been fixed. Finally, my program is yielding some ridge points (1800 in total in an image). I would soon be looking at how i can go about traversing these ridge points and also applying testing the ridgeness function at appropriate scales.

Friday, June 08, 2007

Skeletonization of vessels

I have not been the most efficient person for the past two weeks. I think I have been thinking too much about other things. I am finishing up my MIUA paper final revision which was accepted for an oral presentation for the upcoming MIUA conference .

For the past week, amongst other things (setting up cricket matches), I have been looking at various vessel analysis techniques especially R. Manniesing's PhD thesis titled "Image analysis in CT Angiography". Here I was stomped by some unfamiliar techniques such as diffusion filters and level set methods.

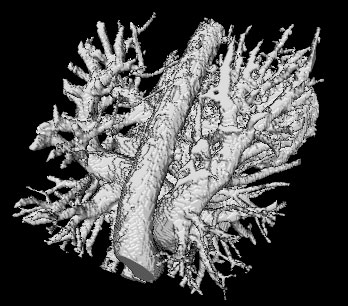
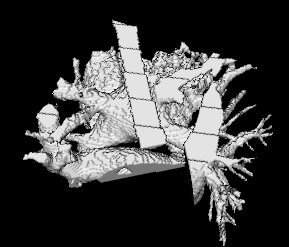
Diffusion filters are governed by diffusion equations which basically control the amount of diffusion when applying the Gaussian filter to vessel boundaries. The main idea is to come up with a non-linear diffusion co-efficient (a.k.a conductivity coeff.) which stops diffusion at the vessel boundaries thereby preserving the vessel topology. I was interested in exploring this area since I was a little concerned about the amount of noise in some of my new MRI datasets. The application of the Gaussian blur to the images with low variance has actually not done much harm to the pulmonary veins and its branches. Here are some images to prove that in atleast one of the datasets:


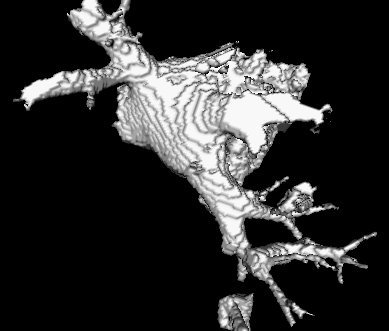
And their surface reconstructions show how easy it is to work with the Gaussian blurred image (bottom image):


So I was quite convinced that the Gaussian blur was rather a blessing than a curse. I thought perhaps I should apply it to my previous MRI studies (which are not as noisy as the new sets) and improve the segmentation results.

I diverted my attention by the middle of the week, away from noise-removal to vessel-axis tracking. I felt that this was prime to two things: 1) Eventually enabling the separation of the pulmonary vein from the artery. 2) Eventually being able to determine the number of pulmonary veins to an atrium. Manniesing's PhD thesis gave a very interesting insight into how Level set methods along with prior vessel topology information can be used to segment the vessel-axis. I have been off-beat with Level set methods and spent the remaining week listening to Level set methods lecture from MIT's opencourseware lecture series for their Mathematical Methods for Engineer's course run by R. Strang. A link to the entire series can be found here.

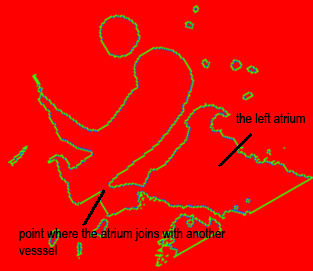
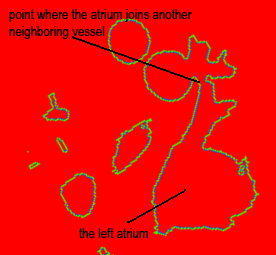
After meditating on a half-an-hour tube ride, I am a little convinced that given that the vessel-axis of the pulmonary vein and the artery can be tracked, they can be separated trivially. However, what worries me most is that it won't be as trivial to obtain the vessel axes at the vein-artery junctions.

off note, I feel compelled to say that I have started taking some interest in world history.

Monday, May 21, 2007

Morphological Operators

I have taken a different approach to the pulmonary vein ostium search problem. 'Primitive' machine vision techniques such as opening and closing can be applied to certain binary images in order to decompose them into their meaningful parts and separate them from their extraneous parts. These happen to be very useful operators. It is derived from mathematical morphology which is a theoretical model for digital images built using lattice theory and topology. So it is back to the basics of machine vision - and I am a little more than glad that I am doing hands-on morphology. I take it as one of the 'must-know' concepts in machine vision.

I will be looking to separate the atrium from its pulmonary veins using these operators. Although surely the operators, on its own, will not be sufficient to do such a task. At this end, I am also looking to possibly implement knowledge-based operators. These operators will incorporate knowledge about the subdivisions (such as their radii, etc.)

Although reading about the fundamentals of mathematical morphology was not great fun, however, I found this book by Haralick to be really helpful. I also found these lecture notes from the U. of Edinburgh informatics site easy to read and understand.

This Friday I picked up more atrium data from my clinician. We are looking at the possibility of exploring a different technique to the atrium segmentation problem.

Tuesday, May 15, 2007

Removal of Partial Volume Effected Voxels

As I had pointed out earlier in previous posts, perhaps the one and only reason the segmentation algorithm leaks into surrounding structures especially the aorta and the pulmonary artery is because of partial volume effected voxels. We have observed that the segmentation at times will leak into the pulmonary artery through a pulmonary vein. Although, it is physically possible, atleast in theory, for the pulmonary vein to touch the pulmonary artery. However, our images are Angiographic scans where the blood was Gadolinium-enhanced and the only thing that we see after subtracting the pre-Angio from the post-Angio is the blood pool. So, we can rightfully state that the blood pools of the pulmonary artery and the pulmonary vein cannot physically touch and this is definitely caused by partial volume effected voxels. Partial volume effected voxels are voxels that image two or more tissue types, thus giving an intensity level that is a weighted average of the intensity levels of each tissue type.

So here arises a dire requirement to identify partial volume effected voxels and remove them as much as possible. I have been looking at some papers recently such as Ballester et. al., and my task for this week will mainly be literature review of partial volume effect removal techniques.

Sunday, May 06, 2007

About subdivisions

A lot of the atrium segmentation computations depend on how the MRI image is subdivided into subdivisions (or basic components) and also partly on the location and spatial distribution of the local maximum and saddle points. Subdivisions are the collection of voxels each of which lead to a local maximum by following a path of increasing EDT values. Now, although intuitively these subdivisions could be thought of as one group of neighboring voxels, however, as I just found out this is not the case. The subdivisions can actually be a disjoint group of voxels as shown below in the figure. Notice that this is one single subdivision that is centered by the local maximum voxel marked in green (by the red arrow). The trail of points indicate the path that leads to the local maximum for a point in the smaller disjoint subdivision.


Here is another image of the same subdivision with the opacity changed to show the opaqued surface.


This is the main reason behind why the boundaries between certain subdivisions dont have a saddle point. For example if we look at the smaller disjoint group in the subdivision shown above in the figure, this smaller group may not have a saddle point with its neighboring subdivisions, since the other larger disjoint subdivision have satisfied the saddle point requirement by having a saddle point with a neighboring subdivision. Ideally we wouldn't have wanted subdivisions to be disjointed in this manner. As explained, this causes some subdivison boundaries to not have saddle points. This has implications in the work we are currently doing where we are trying to locate ostium centers automatically.

Monday, April 30, 2007

Doubts over saddle point locations

I set off to another glorified week when I intend to investigate the possibility implementing an automatic pulmonary vein detector. From the segmented atrium I wish to locate the pulmonary vein drainage ostium automatically so that their diameters can be calculated by some interactive means.
I had doubts over whether the saddle point algorithm was correctly detemrining the points on the image. A thorough close-examination of the algorithm and after some gruesome hours of analyzing the basic component maps I have come to the conclusion that the saddle point algorithm is working fine. I may not be color coding the BC maps correctly at times, so when the saddle points are overlaid over a color-coded BC map, they appear to be located over points which are not boundaries between two adjacent components. This is the case since the color mapper needs to be fine-tuned and by default neighboring components sometime get the same color.
The tube ride today was very instrumental allowing me to finally think of a way the automatic PV drainage detection can be done. I have noticed that the atrium is nicely subidivided at the ostiums for most of the cases. The only thing that needs to be done is to characterize these ostiums interms of the subdivisions or perhaps saddle point diameters.

Friday, April 27, 2007

MIUA paper

It has been a hectic week working on my first ever conference paper. The Medical Imaging Understanding and Analysis 2007 conference is to be held in Wales this year, and I am looking forward to visiting the place. Here is my paper on left atrium segmentation.

Monday, April 23, 2007

Basic component subdivision is random


Today I investigated how subdivision occurs near the pulmonary artery and pulmonary vein intersections. Intersections are caused by partial volume effects. I managed to analyse two datasets. In both datasets I have determined that the subdivision process is fairly random (although I still believe that to some extent it depends on the shape, but then again the shape is quite random near PV+PA intersections). The above image is a slice through the MRI showing the different subdivsions (color coded, i.e. a different color for each subdivision). The marked region within the image shows a pulmonary vein what is part of the left atrium but becomes part of the pulmonary artery due to the way that region was subdivided.

Ideally I would have liked the region marked to be a separate subdivision so that it could be merged in with the subdivisions at the atrium. This creates a massive problem where these subdivsions no longer make sense. Previously I have been under the impression that the left atrium would be uniformly subdivided. Thoughts on which directions to proceed: 1. Use a different neighborhood for picking local maximums (currently we use a 26-neighborhood).

Friday, April 20, 2007

Automatic segmentation

I have passed my MPhil to PhD transfer. Transfers can take a long time: it took me about 2 months to prepare the report and compile results. It is a good idea to write up the transfer report in thesis style keeping in mind that some parts of the transfer report can be recycled to be used in the final thesis.

It is now possible to automatically segment the left atrium using a subdivision and merging algorithm. The atrium is subdivided into disjoint components using some geometric means. These components are then automatically merged using a criterion defined on any two neighboring components. The merging criterion is defined using the notion of a narrowing. Any two neighboring components separated by a narrowing are not allowed to merge. This uses the assumption that the atrium is attached to neighboring structures only through narrow vessels. Allowing the merging to start from the center of the atrium, and stopping the merging at these narrowing can segment the atrium. However, we report that this assumption is not entirely correct. Narrowings can occur within the atrium itself: we have encountered a patient case where the left atrium opens into a pulmonary vein through a narrowing.


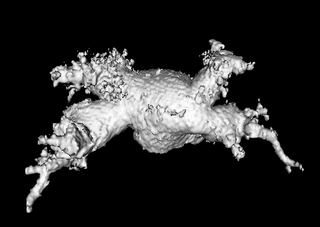
Seen above is a surface reconstruction of a left atrium segmented using the automatic scheme described above. A unusual narrowing within the ostium of a pulmonary vein caused the segmentation to miss the pulmonary vein completely. This was corrected by setting a second seed point at the center of the missed vein, and automatically segmenting and merging it with the original segmentation.

Above is my cartoon representation of a left atrium and its surrounding structures. Assume the blue tubular structure to be the ascending aorta, and the green structure to be the pulmonary artery. The left atrium is drawn in red. Using the narrowing scheme we described above, it still becomes difficult to separate the atrium from the pulmonary artery. The artery and the pulmonary veins touch as seen in the figure, and this is due to the partial volume effect. There is no genuine narrowing at these points (where the vein intersects the artery). As a result we have the system thinking that components on either side of this touching point should be merged - causing segmentation to leak into the artery.

We are looking at different ways to overcome this problem. It may be useful to compute the medial axis transform of the vessels. Vessles which touch due to partial volume effects may not have their medial axes touching. We could perhaps exploit this feature and detect where partial volume effect caused non-mergeable components to be merged.

Acknowledgements: The automatic segmentation technique was adopted from John et. al. 2005.

Friday, November 17, 2006

Surface and volume renderings of Left-atrium MRA

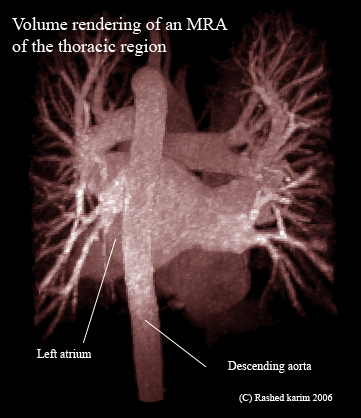
We are ready to show our results and get it verified from the cardiologist. Here are some images showing both volume and surface renderings of the Left atrium with respect to the entire thoracic region. These are MRA scans where the patient is injected with a radio-contrasting agent such as Gadolinium, hence causing the blood vessels to appear as bright structures.


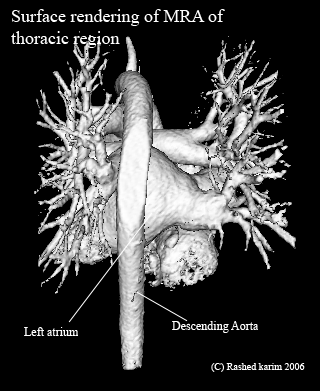
Following is a surface rendering of the above image. One can see the surrounding structures and the descending aorta.


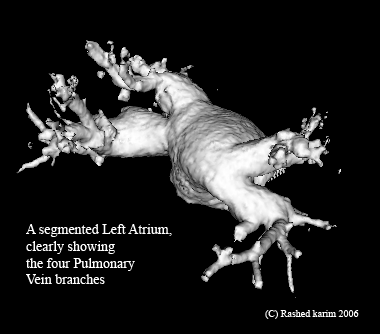
The following image is a surface-rendering of the left atrium which was posted earlier. The previous post featured the same image, however with a lot of noise generating from the extra triangles which were produced as a result of choosing an incorrect threshold in the marching cubes algorithm.


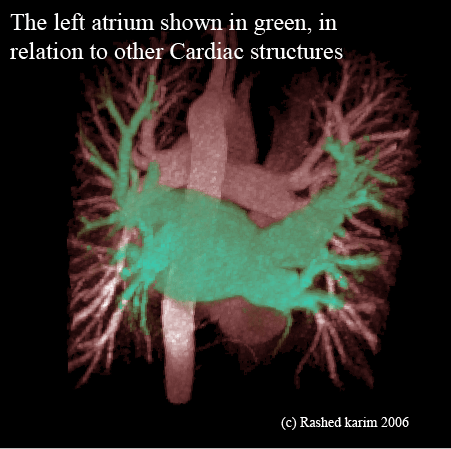
This is apparently one of cardiologists' favorites. The following is a volume rendering of the left atrium and can be seen segmented in green and viewed w.r.t. to its neighboring structures.

Monday, November 13, 2006

A second Atrium

Finally I have got my hands on a second atrium MRA. It is quite different in shape and topology, from the first atrium. It is quite intriguing how such varying shapes of the same organ can occur in nature. The atrium is much larger in shape compared to the previous one, and has thicker PV branches. Such topological variations can make it very difficult to model the shapes using statistical models. One might need to resort to incorporating other techniques that can encode a-priori information, such as probabilisitic atlases.


The MRA data appears to contain a significant amount of noise. I am not entirely certain if this is due to actual noise, or if it's being caused by the rendering algorithm. In the near future, I will be looking more closely into this patient's MRA data and attempt to acquire better images of the segmentation.

Friday, November 10, 2006

Left atrial shape changes

I have come across scores of works which investigate the ventricular volume changes during the cardiac cycle. It has important applications, and is primarily used to quantitatively assess functional parameters such as wall motion, wall thickness and ejection fraction. Considering the fact that the ventricle changes shape, it is not unusual to expect the left atrium to also change its shape. The systole (when the heart contracts) and diastole (when the heart relaxes) are evident in all the four components of the heart. Little work has been done to investigate the atrial volume, and the only piece of work I could find is this. The authors investigate the changes in left-atrial volume in healthy children using 3D Echocardiography.

The changes in left atrial volume can have implications in RF ablation surgery. H. Zhong et. al. describes the RF surgery well in here by comparing it to a painter trying to paint a wall (left atrial endocardium) with his brush (catheter). Assuming that the painter has made an impression of what he is going to paint before hand, on a piece of paper. If the wall started moving, it would be quite trivial to paint it if the painter's motion and the wall's motion are registered (finding a one-to-one correspondence) , along with that of his impression. The hurdle is to be able to solve this correspondence problem and register our 4D model of the atrium with that of the acquired MRI/CTs. H. Zhong et. al. attempts to solve this in their work.

The MRI datasets came in just today, and I will be looking at more atrium segmentation (for training data) in the coming week.

Monday, October 30, 2006

Awaiting to get more MRI

I get most of the MRI data from patient-studies at the National Heart and Lung Institute in London. I work primarily on MRIs obtained after an Angiogram. An Angiogram is a technique in which the blood is injected with a radio-contrasting agent such as Gadolinium. This causes the contaminated blood to appear as bright white in the MRI. Blood vessels and heart structures such as the Left atrium 'light-up' due to this contamination.

I had received quite a number of MRI studies from a cardiologist in early March this year. Most of these do not have an Angiogram. The ones that do, only captured the contaminated blood before it had flowed into the left atrium, leaving the LA invisible.

I will be awaiting to acquire more MRI studies, in order to segment a few more of left atriums. Segmenting more atriums will help us validate and confirm the correctness of our segmentation and provide us with enough training data to (possibly) build a statistical model.

Wednesday, October 25, 2006

Some more segmented atriums

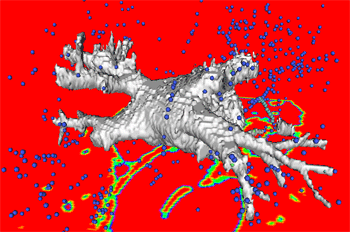
Segmenting each atrium takes less than about 10 minutes. Here is an atrium segmented showing all four PV drainages.


The points around the left atrium are the local maximum points, and the red-background is the EDT map of the original image. With little training, it is fairly easy to segment the PV drainages using this method. In the final segmentation step, the user picks local maximum points, and the voxels which are part of the basic component centered by these local maximum points are revealed. The user must be trained before-hand on which local maximum points to pick. It is a fairly trivial task to pick local maximu points on the PV drainages, since the local-maximum points in the PV drainages lie roughly around a straight-line


Saturday, October 21, 2006

More segmented left-atriums

I have been experimenting to find out how my implementation performed in segmenting the atrium. Here is one of the cases I have been looking at very closely. I especially like this case since the original image from which the left atrium needs to be extracted is quite 'mesh'-ed within the MRI with the atrium concealed completely inside. Here's the original image:


This is almost the entire thoraic region segmented from an image which was obtained by subtracting a post-angiographed from a pre-angiographed MRI (in order to remove the bone structures).

The atrium, after computing the local maximas and basic components surprisingly yielded very few orphans (those which dont belong to a basic component). This is however, not the case with some other segmented images/MRI. I quite do not understand yet what feature of an Euclidean distance transformed image causes these orphans to occur. However, a very preliminary speculation has led to me thinking that it might be because of the absence of local-maximum points in the vicinity of image-edges. Usually, it is the case that when searching for a voxel's basic component close to an edge of the image, the path gets led to a neighborhood of voxels with 0 EDT values. Once it enters such a neighborhood, the search terminates, since the path has exited the EDT-transformed image and it's impossible to search any further. There could be ways of somehow searching further by querying perhaps the original image itself. I might be soon looking at these possibilites soon.

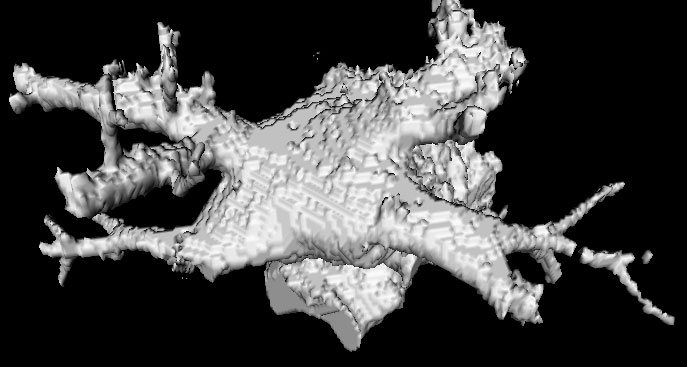
Here is a segmented atrium I obtained by running the implementation on the original image above. The good thing about this segmented atrium is that it reveals all the pulmonary-vein drainages, in addition to also showing how the drainages are branching out.


Thursday, October 19, 2006

Breakthrough

After spending an entire week optimizing and debugging code, I am finally able to segment the left atrium semi-automatically. Semi-automatic in the sense that it requires user-interaction where the user first needs to crop a region-grown segmented MRI, approximately locating where the atrium lies. This step is not essential to the algorithm, however, it speeds up significantly the EDT (Euclidean distance transform) computation. In the next step, the local maximum points are computed. Interestingly, these were arranged in a very interesting fashion on the atrium. I will discuss this in further detail on future posts.

After computing the local maximas, for each voxel in the segmented MRI, its basic component is computed. A voxel's basic component is its closest reachable local maxima where the path must be the one with increasing EDT values. I have noticed that some voxel's don't belong to a basic component. I call these voxels orphans. These usually occur when during a basic component path search, the search-path explodes into a neighborhood of voxels with zero EDT values. In which case, there is no one local maxima point and hence no basic component. These may cause discontinuity within an atrium or its drainage vessels.

Here is the original image, from which the atrium was segmented, one can hardly see the atrium as it is surrounded by a dense mesh of blood vessels and the aorta.


And here's the segmented atrium:


In the final segmentation step, the user clicks on local-maximums which approximately lie inside the atrium. This reveals all voxels which belong to basic components centered by the selected local-maximas. This system cant be navigated by someone who hasn't seen an atrium before.

The segmentation technique is quite powerful and it can prove to be very useful in extracting structures that are embedded within a dense mesh of blood-vessel-like structures like the atrium.

Programming note:

func (a)
{
for ( .. )
*p = new someClass(a,b,c)
}

Doing the above, for some reason, doesn't clear up memory held by someClass objects on exiting the function func.

Wednesday, October 11, 2006

Cutting the blood pool at narrowings

Mathias John's paper discusses how the atrium can be segmented by cutting the blood pool at narrowings. I have been trying to identify the narrowings where I would ideally like to cut the blood pool. Here are two images which show the left atrium, the narrowings at which the atrium needs to be cut at, in order to segment it.


After implementing a system, that can identify the local-maximums of the EDT-transformed image, it has been possible to perform a preliminary segmentation of the left atrium.

There are 220 local maximums, and some of these maximums lie within the vicinity of the left atrium. These local maximums play a crucial role in segmentation. My theory is (and possibly M. John's theory) voxels which will lie within the atrium will be part of a basic component centered only by those local maximums.

I have run several test cases to check this and all of them strongly suggest that this is the case.


Monday, October 09, 2006

Left atrium segmentation and local maximas

I have been lately looking at the paper 'Automatic Left atrium segmentation by Cutting Blood pool at narrowings' by Matthias John et. al. My attempt to implement the method is still under-way. The 'apparent' simplicity of their method is the main reason behind the adoptation. Although not entirely non-trivial, their method is far less complicated than other attempts which have been made to segment the right atrium and ventricles.

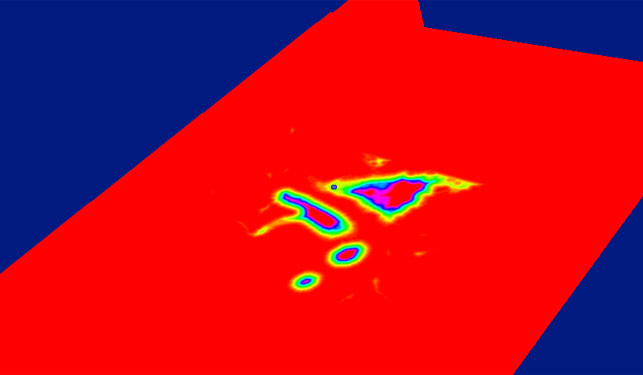
The trick is to first determine the Euclidean distance transform (simply put for each voxel v, the distance to the closest unmarked voxel is the EDT for that voxel v. An unmarked voxel is that with a scalar value of 0). Here is a EDT color-coded map of the left atrium and surrouding heart structures and vessels. The red regions indicate high EDT, with gradually decreasing EDT as you move away from the center of the atrium (and other structures), which is indicated by other colors.

The image is however badly represented on red planes, which color-clashes with our red for high-EDT indicator.

After the EDT is determined, the next step is to locate the local maximas within the image. This is fairly trivial and not greatly processor intensive. For each voxel, a 14 or a 26-neighborhood is examined to determine if the voxel has the largest EDT in it's neighborhood. This would occasionally be the case, since there is almost always a neighbor with a larger EDT. Using a 26-neighborhood, my system yields around 220 local maximums. If you use a 10x10x10 neighborhood, you will only end up with 8 local maximums. The local maximums usually occur at the bary-center of the structures, indicating the deepest points in the structure.

Once the local-maximums have been determined, the subsequent step is to assign every voxel to a basic component. A basic component is a subset of the image. I like to think of it as the k-th partition of the image, where the image can be divided into n partitions with each partition being called a basic component. Each voxel ends up in one of the n partitions. The partitions are divided according to the local-maximums, with each parition having a local-maximum at its bary-center (or simply center). A voxel belongs to a partition, iff by following its gradient we end up at that partition's center (a local max). We follow the voxel's steepest gradients (i.e. with the largest EDT value).

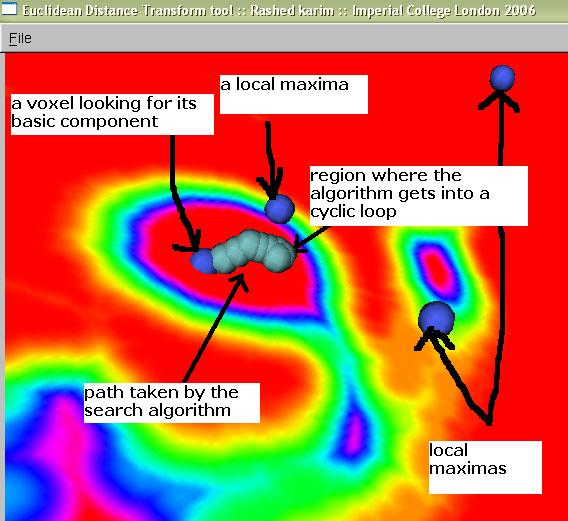
I have been trying to implement this and visualize how a voxel can be assigned to a basic component partition. The following image below shows some local-maxs and a path marked by a caterpillar-like object. This path has actually been traced by several spherical points, thus giving it the caterpillar-like look.
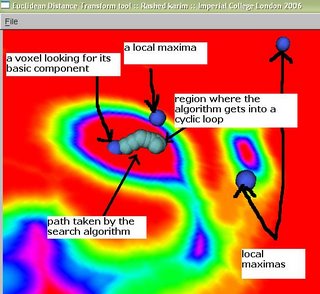

A voxel is looking for its basic component, and this is traced by the path (caterpillar-like) which is trying to reach the local-max right above it (marked in figure by 'a local max'). However, it gets into a never-ending cyclic loop. It is stuck between two voxels that have the largest values in both their neighborhoods. This can be easily avoided if we keep track of which voxels we have visited.


Wednesday, September 27, 2006

Determining local maximas and saddle points of an EDT

I am still studying this paper (left atrium segmentation by cutting blood pools at narrowings) and looking to see if some of the techniques can be adopted and implemented. The blood pool is cut at narrowings which are saddle points. After studying the atrium for sometime now it seems its safe to assume that the atrium is connected to the extra cardiac structures (such as the aorta) by narrow blood vessels. This is the narrowing we are after. Our segmentation step should be able to identify these narrowings. However, saddle points can only be calculated once the local maximas are determined.

Computing saddle points is not trivial. In the mathematical world, saddle points in 3D are points where a function is both convex and concave, on any two chosen direction. For a continuous function, this can be determined by computing the Hessian matrix (matrix of partial derivatives) and checking if the eigen values of the Hessian are both positive and negative. A good summary is given here.

However, in our 3D graphics world, the saddle point can be determined using an iterative algorithm which examines a neighborhood of pixels (26, 14 neighborhoods). As the paper states, a voxel v is a saddle point if in its neighborhood one can determine two voxels v1, v2 which have a scalar values larger than that v, and these voxels are separated from one another by a ring of voxels with smaller values than v1 and v2 .

I was also able to complete designing an Euclidean distance transform (EDT) tool which computes the EDT for each voxel, given a roughly-segmented atrium. I am visualizing and anlyzing the EDT results to see where the local maximas and saddle points actually occur, and if they are of any real significance in segmenting the atrium.

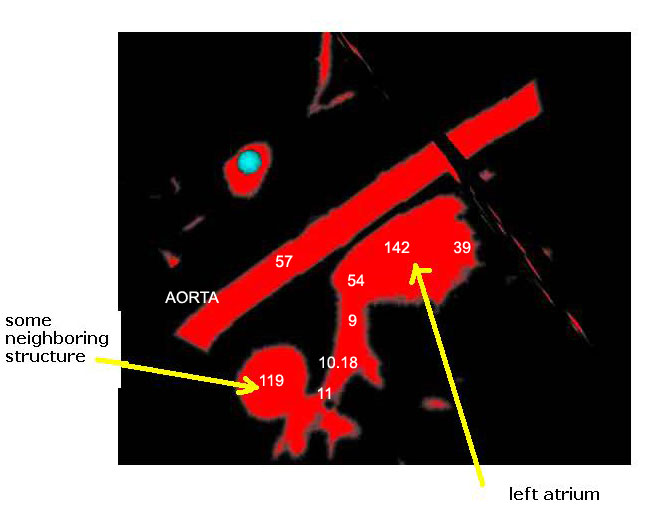
Here's an example of a z-slice I extracted off an EDT I computed over a segmented dataset. What you see in the image below is a certain z-slice of the segmented-MRI showing the EDT values. I have roughly pointed out where these values occur. Notice how the large EDT values indicate a local maxima (major heart structures) and the narrow blood vessels connecting these structures have a low EDT indicating saddle points.