Monday, October 30, 2006

Awaiting to get more MRI

I get most of the MRI data from patient-studies at the National Heart and Lung Institute in London. I work primarily on MRIs obtained after an Angiogram. An Angiogram is a technique in which the blood is injected with a radio-contrasting agent such as Gadolinium. This causes the contaminated blood to appear as bright white in the MRI. Blood vessels and heart structures such as the Left atrium 'light-up' due to this contamination.

I had received quite a number of MRI studies from a cardiologist in early March this year. Most of these do not have an Angiogram. The ones that do, only captured the contaminated blood before it had flowed into the left atrium, leaving the LA invisible.

I will be awaiting to acquire more MRI studies, in order to segment a few more of left atriums. Segmenting more atriums will help us validate and confirm the correctness of our segmentation and provide us with enough training data to (possibly) build a statistical model.

Wednesday, October 25, 2006

Some more segmented atriums

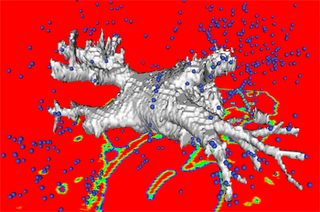
Segmenting each atrium takes less than about 10 minutes. Here is an atrium segmented showing all four PV drainages.


The points around the left atrium are the local maximum points, and the red-background is the EDT map of the original image. With little training, it is fairly easy to segment the PV drainages using this method. In the final segmentation step, the user picks local maximum points, and the voxels which are part of the basic component centered by these local maximum points are revealed. The user must be trained before-hand on which local maximum points to pick. It is a fairly trivial task to pick local maximu points on the PV drainages, since the local-maximum points in the PV drainages lie roughly around a straight-line


Saturday, October 21, 2006

More segmented left-atriums

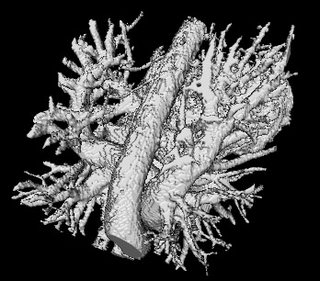
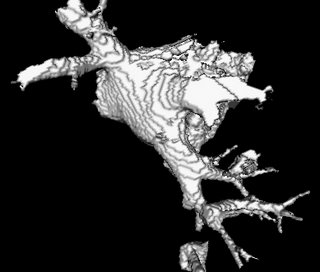
I have been experimenting to find out how my implementation performed in segmenting the atrium. Here is one of the cases I have been looking at very closely. I especially like this case since the original image from which the left atrium needs to be extracted is quite 'mesh'-ed within the MRI with the atrium concealed completely inside. Here's the original image:


This is almost the entire thoraic region segmented from an image which was obtained by subtracting a post-angiographed from a pre-angiographed MRI (in order to remove the bone structures).

The atrium, after computing the local maximas and basic components surprisingly yielded very few orphans (those which dont belong to a basic component). This is however, not the case with some other segmented images/MRI. I quite do not understand yet what feature of an Euclidean distance transformed image causes these orphans to occur. However, a very preliminary speculation has led to me thinking that it might be because of the absence of local-maximum points in the vicinity of image-edges. Usually, it is the case that when searching for a voxel's basic component close to an edge of the image, the path gets led to a neighborhood of voxels with 0 EDT values. Once it enters such a neighborhood, the search terminates, since the path has exited the EDT-transformed image and it's impossible to search any further. There could be ways of somehow searching further by querying perhaps the original image itself. I might be soon looking at these possibilites soon.

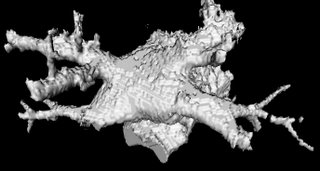
Here is a segmented atrium I obtained by running the implementation on the original image above. The good thing about this segmented atrium is that it reveals all the pulmonary-vein drainages, in addition to also showing how the drainages are branching out.


Thursday, October 19, 2006

Breakthrough

After spending an entire week optimizing and debugging code, I am finally able to segment the left atrium semi-automatically. Semi-automatic in the sense that it requires user-interaction where the user first needs to crop a region-grown segmented MRI, approximately locating where the atrium lies. This step is not essential to the algorithm, however, it speeds up significantly the EDT (Euclidean distance transform) computation. In the next step, the local maximum points are computed. Interestingly, these were arranged in a very interesting fashion on the atrium. I will discuss this in further detail on future posts.

After computing the local maximas, for each voxel in the segmented MRI, its basic component is computed. A voxel's basic component is its closest reachable local maxima where the path must be the one with increasing EDT values. I have noticed that some voxel's don't belong to a basic component. I call these voxels orphans. These usually occur when during a basic component path search, the search-path explodes into a neighborhood of voxels with zero EDT values. In which case, there is no one local maxima point and hence no basic component. These may cause discontinuity within an atrium or its drainage vessels.

Here is the original image, from which the atrium was segmented, one can hardly see the atrium as it is surrounded by a dense mesh of blood vessels and the aorta.


And here's the segmented atrium:


In the final segmentation step, the user clicks on local-maximums which approximately lie inside the atrium. This reveals all voxels which belong to basic components centered by the selected local-maximas. This system cant be navigated by someone who hasn't seen an atrium before.

The segmentation technique is quite powerful and it can prove to be very useful in extracting structures that are embedded within a dense mesh of blood-vessel-like structures like the atrium.

Programming note:

func (a)
{
for ( .. )
*p = new someClass(a,b,c)
}

Doing the above, for some reason, doesn't clear up memory held by someClass objects on exiting the function func.

Wednesday, October 11, 2006

Cutting the blood pool at narrowings

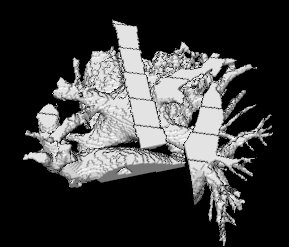
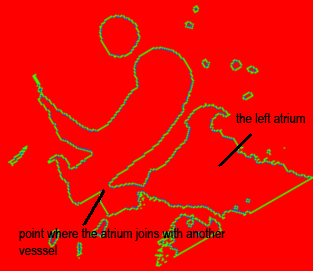
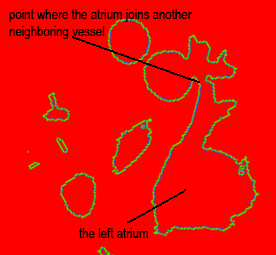
Mathias John's paper discusses how the atrium can be segmented by cutting the blood pool at narrowings. I have been trying to identify the narrowings where I would ideally like to cut the blood pool. Here are two images which show the left atrium, the narrowings at which the atrium needs to be cut at, in order to segment it.


After implementing a system, that can identify the local-maximums of the EDT-transformed image, it has been possible to perform a preliminary segmentation of the left atrium.

There are 220 local maximums, and some of these maximums lie within the vicinity of the left atrium. These local maximums play a crucial role in segmentation. My theory is (and possibly M. John's theory) voxels which will lie within the atrium will be part of a basic component centered only by those local maximums.

I have run several test cases to check this and all of them strongly suggest that this is the case.


Monday, October 09, 2006

Left atrium segmentation and local maximas

I have been lately looking at the paper 'Automatic Left atrium segmentation by Cutting Blood pool at narrowings' by Matthias John et. al. My attempt to implement the method is still under-way. The 'apparent' simplicity of their method is the main reason behind the adoptation. Although not entirely non-trivial, their method is far less complicated than other attempts which have been made to segment the right atrium and ventricles.

The trick is to first determine the Euclidean distance transform (simply put for each voxel v, the distance to the closest unmarked voxel is the EDT for that voxel v. An unmarked voxel is that with a scalar value of 0). Here is a EDT color-coded map of the left atrium and surrouding heart structures and vessels. The red regions indicate high EDT, with gradually decreasing EDT as you move away from the center of the atrium (and other structures), which is indicated by other colors.
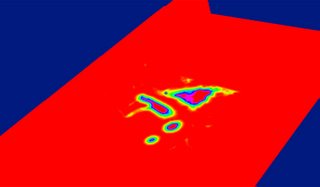

The image is however badly represented on red planes, which color-clashes with our red for high-EDT indicator.

After the EDT is determined, the next step is to locate the local maximas within the image. This is fairly trivial and not greatly processor intensive. For each voxel, a 14 or a 26-neighborhood is examined to determine if the voxel has the largest EDT in it's neighborhood. This would occasionally be the case, since there is almost always a neighbor with a larger EDT. Using a 26-neighborhood, my system yields around 220 local maximums. If you use a 10x10x10 neighborhood, you will only end up with 8 local maximums. The local maximums usually occur at the bary-center of the structures, indicating the deepest points in the structure.

Once the local-maximums have been determined, the subsequent step is to assign every voxel to a basic component. A basic component is a subset of the image. I like to think of it as the k-th partition of the image, where the image can be divided into n partitions with each partition being called a basic component. Each voxel ends up in one of the n partitions. The partitions are divided according to the local-maximums, with each parition having a local-maximum at its bary-center (or simply center). A voxel belongs to a partition, iff by following its gradient we end up at that partition's center (a local max). We follow the voxel's steepest gradients (i.e. with the largest EDT value).

I have been trying to implement this and visualize how a voxel can be assigned to a basic component partition. The following image below shows some local-maxs and a path marked by a caterpillar-like object. This path has actually been traced by several spherical points, thus giving it the caterpillar-like look.
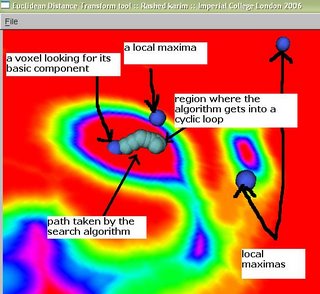

A voxel is looking for its basic component, and this is traced by the path (caterpillar-like) which is trying to reach the local-max right above it (marked in figure by 'a local max'). However, it gets into a never-ending cyclic loop. It is stuck between two voxels that have the largest values in both their neighborhoods. This can be easily avoided if we keep track of which voxels we have visited.