I am still studying this paper (left atrium segmentation by cutting blood pools at narrowings) and looking to see if some of the techniques can be adopted and implemented. The blood pool is cut at narrowings which are saddle points. After studying the atrium for sometime now it seems its safe to assume that the atrium is connected to the extra cardiac structures (such as the aorta) by narrow blood vessels. This is the narrowing we are after. Our segmentation step should be able to identify these narrowings. However, saddle points can only be calculated once the local maximas are determined.
Computing saddle points is not trivial. In the mathematical world, saddle points in 3D are points where a function is both convex and concave, on any two chosen direction. For a continuous function, this can be determined by computing the Hessian matrix (matrix of partial derivatives) and checking if the eigen values of the Hessian are both positive and negative. A good summary is given here.
However, in our 3D graphics world, the saddle point can be determined using an iterative algorithm which examines a neighborhood of pixels (26, 14 neighborhoods). As the paper states, a voxel v is a saddle point if in its neighborhood one can determine two voxels v1, v2 which have a scalar values larger than that v, and these voxels are separated from one another by a ring of voxels with smaller values than v1 and v2 .
I was also able to complete designing an Euclidean distance transform (EDT) tool which computes the EDT for each voxel, given a roughly-segmented atrium. I am visualizing and anlyzing the EDT results to see where the local maximas and saddle points actually occur, and if they are of any real significance in segmenting the atrium.
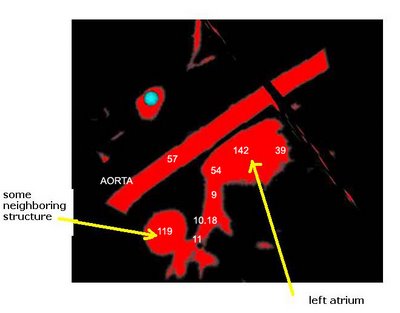
Here's an example of a z-slice I extracted off an EDT I computed over a segmented dataset. What you see in the image below is a certain z-slice of the segmented-MRI showing the EDT values. I have roughly pointed out where these values occur. Notice how the large EDT values indicate a local maxima (major heart structures) and the narrow blood vessels connecting these structures have a low EDT indicating saddle points.

No comments:
Post a Comment