Thursday, April 27, 2006

Region growing segmentation


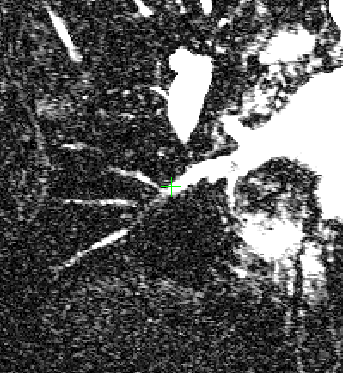
Region growing segmentation seems like a relatively easier thing to use to segment the pulmonary venous drainages. I will be trying to implement a Seeded Region Growing segmentation to start extracting the drainage patterns. However, I anticipate that Region-growing might not work perfectly with veins. The problem with region growing is that it seems to explode and find its way out somehow out of the region which we are interested in. To get a jist of how difficult segmentation might get, have a look at the MRI image above. I wish everyday that MRI image acquisition was clearer.
In near future, I will also be looking at other image segmentation techniques used in medical imaging. There is a good piece of literature out there that explores out all the different techniques that have popularly been used in segmenting medical images. Here's the paper.

Wednesday, April 19, 2006

VTK Error

I have been stuck for about a couple of weeks trying to get rid of this error
vtkVolumeRayCastMapper Cannot volume render data of type short, only unsigned char
or unsigned short.
that I have been getting when I was trying to MIP render a GIPL image. I was finally able to resolve the issue, with Prof. Daniel's help. I have looked around the web for a solution, and all of the solutions that I have looked at didnt help. Infact, people working with ITK (Insight ITK) commonly face this problem when they are trying to render an ITK image.

The solution is simple, only if you knew the vtk classes inside out. Anyone would have guessed what needs to be done here: we simply need to make sure that the scalar values we have in our vtk data set (vtkStructuredPoints for e.g.) are non-negative values. Well, if you have negative values, you want to make sure that you can scale them back to the set of positive real numbers. The way you do this is by first determining the minimum and maximum of your scalar values and then setting the minimum to be 0. So if -5 is the minimum, you set it to zero and add all the other scalars by 5. Once you have non-negative values, all you now have to do is pass the vtk data through a small pipeline. A pipeline is an important concept which I learned about today. Most VTK textbooks have this explained well. What it really is that the output of a filter becomes the input of another filter, and this is done by using common vtk functions such SetInput and GetOutput. Going back to our discussion, once we have non-negative values, we need to cast and make sure that we can safely cast. If you have scaled your scalars properly, it should be a safe cast.

vtkImageCast *vtkImageCast = vtkImageCast::New();
vtkImageCast->SetInput(vtkImage);
vtkImageCast->SetOutputScalarTypeToUnsignedShort();
....... // somewhere down the line ...
volumeMapper->SetInput(vtkImageCast->GetOutput());

As you can see, a new vtkImageCast object casts the vtkStructuredPoints vtkImage object's scalar values to unsigned short and then the GetOutput function is called to feed the output to the renderer.


Saturday, April 15, 2006

Moving homes and other stuff

I have been spending most parts of this entire week either at Glu or trying to move out to my new apartment. Looking for a place to stay in London is harder than solving an optimization problem with defined constraints. My interview at Google is very soon and I am very excited aboout it. It is one thing that I noted about Google that is atleast different from Microsoft, Google's hires a lot of "academically" bright students, and I mean students from the good schools with the good grades. I have been reading a couple of profiles and quite a handful of them even have PhDs. I think Microsoft puts much more emphasis on programming quality and ability than any other thing.

I have been working on my MRA visualization. Somewhere in VTK i am having problems trying to render an ITK image. Apparently some common VTK rendering functions (such as ray-casting, MIP) can only render volumes with voxel scalar values that are of type unsigned short/char. The ITK images which I have are of type signed ints. It does not make sense to me why VTK designers would want the format to be unsigned short/char. unsigned makes sense, but why short and not an int?

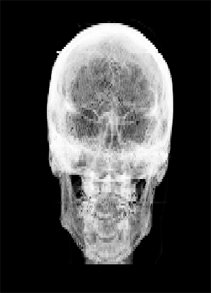
At the same time, I am also working on a coursework which was due ages ago. Here is a rendering of the skull using Back-to-front (BTF) compositing. The rendering is very basic since I have only used a single threshold and no lighting model. I have also limited the colors B/W as I wanted to get an X-ray like image. The original volume is from a CT scan though. So here you go, your CT to X-ray converter.


Friday, April 07, 2006

ITK + VTK Compiled

After a long haul, VTK and ITK finally compiled. The problem was with having VTK not installed properly on my machine. The thing with open source software is that the installers (if any) are not that great. Sometimes, as it did with me, it installed a version of VTK that was not fully compatible to run on my OS. The best thing to always do is to download the source and compile it using your compiler. That's what I did with VTK, when I realized that it was not working with ITK. There were also problems with Project (ITK), and things needed to be updated. I also had to install FLTK in order to install rview. rview apparently doesn't work without FLTK. There are also other little things that I should be careful about: for e.g. turn the Advanced options on when CMake-ing, and make sure you have put the GL/gl.h and glut32.lib files under your compilers lib folders (such as vc7/lib). However, as a piece of advice, the best thing to do is to read the errors carefully when compiling ITK and to stay calm when errors > 100 show up (after which vc .net stops compiling further :(( )


Wednesday, April 05, 2006

A thing called CygWin

CygWin is a blessing to the windows operating systems. Basically it makes your Windows system acts like a UNIX OS. It provides some basic UNIX OS functionality together with programming development tools like GCC, etc. You could run xemacs/emacs on cygwin as well. So, if you are an emacs person and run windows on your PC (a rare combo) you should probably get CygWin.

CygWin also allows X11 forwarding through its CygWin/X package. So basically, you could connect to a remote linux/Unix server and get the graphical output on your WinOS. And fundamentally, Cygwin consists of a library that implements the POSIX system call API in terms of Win32 system calls.

I have been trying to setup CygWin/X. And today I got stuck trying to configure X11 forwarding and setting up display settings, although I had done it some time before. Basically you need to call the startwin.sh script, as described in here. After that you can ssh to your remote host on the X-window (window that appears after you run startwin.sh).

Tomorrow I get to meet Prof. Daniel. My ITK build is now completely messed up. I cleaned up the build and now after re-building it gives me errors which I never got before. I have written a basic visualization code. I also need to invest some time in getting my Adv. viz. coursework program code to work.

Tuesday, April 04, 2006

For most parts of the weekend, I have been spending my time at Glu. Its seems like its been a while since I have taken time off, and Sunday was finally a holiday for me. I am working on my Advanced graphics coursework that requires me to render a brain CT scan using fundamental rendering algorithms. The coursework looks complicated and I am right now trying to run it on Windows. ddd Debugger is horrible. I was stuck trying to figure out what an error meant, which popped out everytime I ran ddd on the executable. To make a program debuggable, you must gcc it with a -g switch. Ah well, ddd has a poor array analyzer. I remember back in my MSc days, when I used visual C++ 98 to examine arrays, and it was so much simpler.

The coursework requires openGL. And to my surprise, the download links to SGI's openGL does not work! I recently learned that Windows OS ships with OpenGL 1.1. I have no clue about where the exes and dlls are located.

My PhD work this week is currently at a Standstill. I am still trying to do my visualization code. On Monday I had translated some of the VTK python/TCL code to C++ for visualizing using some basic rendering function. I cant remember what rendering I used, but thinking about it right now, what could be simpler than MIP rendering??? :) Strangely, at this point I cleaned my ITK build, and it is not compiling anymore. There are scores of errors and perhaps I need to go to Raj or Prof.


Wednesday, March 29, 2006

Stuck with VTK

It's getting a nightmare trying to compile programs which use VTK+ITK. Today I spent the entire day trying to learn how to use VTK for visualizing a dataset. After our meeting I learnt how ITKImage has functions that can convert a gipl image to a vtk structured point set (i think thats what they are called). There is also an .exe called "convert" that converts gipl to vtk format.

The next two days, I will be spending mostly at Glu.

Meeting with Prof. Daniel

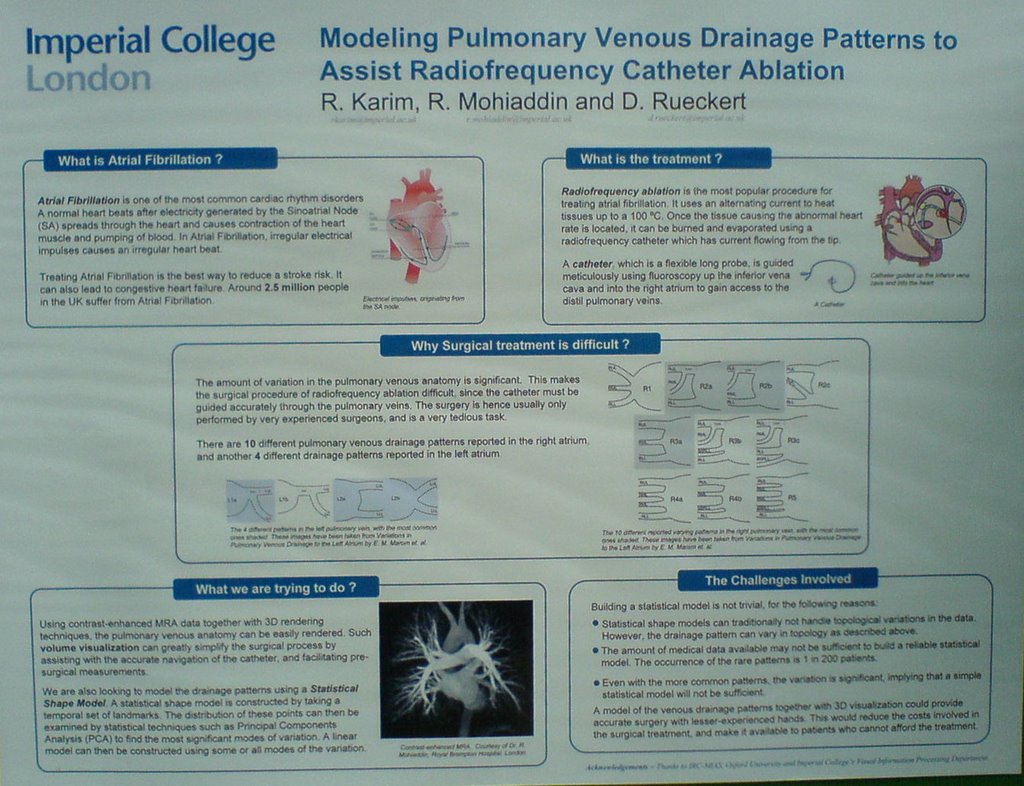
It was a short meeting that we had today. We talked about how important it was for me to get the visualization done as quickly as possible. From there on we are planning to segment the images somehow first using some fundamental segmenting algorithms like Region growing. At some point we intend to be able to automatically get data for creating a Statistical shape model for the pulmonary drainage veins.
I also discussed my meeting with Dr. Tim Cootes at Oxford. After showing him the different drainage patterns, Cootes suggested that it would probably be a good idea to use more than just one shape model to describe a single pattern. However, I also explained to him how difficult it was to acquire images for patterns which are rare.
After discussing the rarity of the patterns, Prof. Daniel suggested that it would probably be a good idea if we could create models for the rare patterns with whatever data we have, and then declare that the model has some limitations. He also said that we could find out what proportion (e.g. 95%) of the data it explains (not clear on this)

non PhD: How do you export highlighted syntax source files

Someone was asking me how you export a highlighted-syntaxed file to a word document. This is something I have never thought of in all the years I have programmed and created reports. Anyways, there is a solution. It happens that one of the editors out there has an export function that enables you to export its highlighted content to various formats such as PDF, RTF (works in Word), XML, etc.
The editor's called SciTE and here's the link to their page.

Tuesday, March 28, 2006

Subtraction works

I finally was able to subtract a Post Angio image from a Pre Angio image. The images are MRIs showing the pulmonary vessels. Subtraction, although a very trivial procedure, took me some time to figure out since I was new to the IDE.

The subtracted iamge reveals the blood vessels. Daniel has suggested that I perform a MIP (Maximum Intensity Projection) rendering on the vessels to analyze the structure. MIP can be easily implemented using the VTK library. I am doing some background reading on basic Computer graphics concepts such as volume/surface rendering. I have got hold of some papers and a book on the VTK library.

Installing Daniel's ITK

I have been trying since weekend (25th March) to set up Daniel's ITK. It has really been difficult. Thanks to Raj. He helped me a lot to set up ITK on Visual .NET. Sometime I need to sit down and write all the installation procedures.

It's simple, first you need to checkout the code (which vip calls Project) from CVS. I have been using Tortoise CVS on windows. You then need CMake to install the binaries, this step is important as CMake produces code optimized for your compiler. Next, it's just a matter of opening up the solution workspace on Visual .NET and building the solution.

What got me the most was how we are supposed to deploy code that we write, which uses the ITK. So for example, if we write code which uses the ITK library, our file (.cc) needs to sit under project/applications. CMake needs to install the binaries once again, and the solution needs to re-built. Its a nuisance doing it over and over again, but thanks to the Visual .net IDE which only compiles files which got recently changed. Look for an option which only builds the file and not the entire solution.

Oxford Uni. for Spring school

I spent a week (Mar 19- 24) at Oxford attending lectures given by some prominent researchers in the field of medical imaging. It was a great learning experience, and I enjoyed my time greatly. For any one interested in the Oxford Spring school, here's the link to their webpage.

The entire conference costs around 500 pounds, and the accomodation is included. We were given accomodation at St. Anne's College. It is a good idea to take your laptop with you. I survived the whole one week without a computer.

I met some people there who are also new researchers in the field of medical imaging. Notably, Arif Asif Qazi at the IT university of Denmark, and others. It was funny that I met a few people from Imperial College for the first time there. Ioannis (neurologist) and Mustafa Anjari (medic) are both working at the Hammersmith hospital, which is also a part of Imperial College.


Wednesday, November 16, 2005

Meeting with supervisor

Today we had our third VIP research seminar. Dr. Chandrashekhara talked about how he's been going about trying to reduce the degree of freedoms/control points for his 3D model of the left ventricle. I am guessing that control points are points at which the model may be deformed. Later, Dr. Chandra told me that a control point has three degrees of freedom (i.e. 3D). He also talked about Subdivision surfaces. This concept is commonly used in computer graphics and animation. From what i understand, you try to smooth a mesh by continuous iterative refinements. The number of refinements are infinite. Here's an example.

There was also a few things said about B-splines. I was a bit embarassed to myself, for not knowing what a B-spline is. I first came across it in a computer graphics course in Toronto. Reviving myself of what it is, a spline is a special (usually complex) curve defined piecewise by polynomials. In computer graphics, splines are normally used in curve-fitting, i.e. to use a curve to approximate some complex shape. The most popular of all B-splines, is the cubic spline.

The talk by Dr. Chandra was followed by a PhD student. I couldn't quite figure out what she was saying. The paper she presented was pretty complicated, owing to the amount of heavy-duty equations it had. There was something about the EM-algorithm that the paper repeatedly referred to.

The seminar was followed by my meeting with Prof. Daniel. I quite completed what he had asked me to complete last week. I was asked to implement Cootes' statistical shape model using MATLAB. It was a trivial task, however, after looking at the approximations the model produced, there is a strong likelihood of a bug somewhere.

I also learned a few important things about modes, etc. If we train our model with n training samples (x1, .... , xn), we will have a covariance matrix which will have n eigenvectors. These n eigenvectors are our n modes. Using this "trained" model, we will now be able to produce an exact replica of an instance of our training set, xi, if we used all the n eigenvectors (i.e. modes). Note, that we use our original xi to produce an approximation for xi (xi hat). However, this is not the case (i.e. it is not an exact replica) if xi is not in the training set, for e.g. i > n. This is also not the case when we dont use all n eigenvectors (i.e. some modes). Actually, what Dr. Daniel told me later that this is a way of testing if our model is correct, i.e. if xi is in the training set, the xi produced should be identical to xi (provided all modes are used).

Hence, using all modes (all eigenvectors) explains 98% (~100%, 2% is noise) of the training set. It is interesting and worth investigating to see how this percentage varies with the number of modes. This week I will be trying to investigate the relationship between the number of modes and the percentage of data that can be explained. I will also try to see if this varies across different training set sizes.

The motivation here comes from the fact that if for smaller training set sizes, we can explain a large portion of our data using some number of modes (i am not sure how many modes), we would be able to reduce the task of manual annotation (landmarking), i.e. smaller training sizes require lesser annotations.


Tuesday, October 25, 2005

PhD :: XP programming

Extreme prorgamming (XP) is a agile software development method, which I came across in the undergraduate Software engineering course that I took at Toronto. It didn't make much sense to me, and usually it doesnt make much sense to people who haven't programmer in the real-world for the real-world. All I remember of XP was that it required programmers to program in pairs. But that is probably a lesser important characterisitic of the agile method. Just the fact that two programmers had to sit together and program in XP, probably amused everyone.

XP is a rapid application development methodology, whereby less time is spent on design. This immiediately requires a lot of refactoring (cleaning up) code, which is another important characteristic of XP. So when do we pick XP over other methods? XP is best used for developing systems which require relatively a lesser amount of design time. So for e.g. e-commerce systems built using the Java framework, would require a far less time spent on design, due to the availability of already-built frameworks (such as JavaBeans, etc.). The developers build on top of the framework, which in a way dictates the programmers to follow a certain design. I say this from my experience at BEA, where portals developed using BEA's Weblogic Workshop, followed a more-or-less standard design rules set by BEA. These rules were obviously well established, and have known to work. The rules could also, ofcourse be changed, by re-configuring a few XML files.

Thursday, October 20, 2005

PhD :: Learning how to teach and what to teach

(Written for yesterday)
Today I have been observing how the computing department here at Imperial college introduces programming to first-year computer science students. Haskell is taught to first years here, and it appears that Haskell is quite popular amongst hackers, as discovered at a programming contest for hackers. More details here. Haskell is a functional language. Not many computer science graduates would have even heard about it. I think it's quite unpopular in the programming community, and the main reason for that is there are other functional languages out there which are "more" functional than Haskell. I have noticed that MIT Scheme, a functional language we were taught at Toronto, resembles Haskell to a certain extent, except that Scheme is purely functional.

No first year computer sciencers get to cross the bridge without doing Java. At Imperial, Kenya is used to introduce students to Java. Well, now Kenya has a different story. It hides from it's learner huge loads of useless information, which for someone leanring java for the first time is really a pain. Kenya is an interface to java, where Kenya code is translated to Java code. So for example a new learner can type "void main" in kenya and this gets translated internally to "public static void main". S/He can learn what "public static ... (String[] args)" later on, and concentrate on the logic required to learn programming.

Other UK universities, who are not proponents (or not aware of) of Kenya, have started using a fairly easy-to-use IDE called the BlueJ.

This year I am tutoring for Software engineering methods and Hardware. Dr. Huth and Dr. Gillies are my sueprvisors, and it is a pleasure chit-chatting with them. I try spending informative sessions with them about the course material, and in the process trying to teach myself how to teach these courses.

My meeting with Dr. Ruckert was cancelled early morning. I am meeting him this Friday. I have spent most parts of the day trying to teach myself Haskell.

Tuesday, October 18, 2005

PhD :: Modelling shape variation using PCA

I spent a major amount of my time reading and trying to grasp the basic concepts used in Principal components analysis (PCA) in Lindslay Smith's tutorial on PCA. This is a very gentle introduction to PCA and lays out the mathematical concepts in a rather very "gentle" way. At first, I thought the paper was meant for psychology students, only later to find a chapter on the use of PCA in machine vision.

A few days earlier, I had learned the true meaning of covariance, which is really the variance measure in higher dimensions. Covariance is usually represented in matrix form, and I believe it is only useful when it is used for higher dimension (The higher dimension gives it the matrix form). Lindslay's tutorial describes covariance really well.

I later refered back to the Cootes' paper on Statistical models, which on my list of literature reviews for the next few weeks. I have understood the idea behind capturing shape variation, however, I still need to understand further the mathematical equations which Cootes has laid out. I find it amusing how a shape described by n points in d dimensions, can easily be represented by a single vector, and compared using PCA.

The fact that an equation can be obtained (using just a single parameter) for a training set, on which a PCA has been performed, is also beautiful. I have peeked further into the paper, and Cootes describes how the distribution of the parameter in the equation can be modeled (from training set) to produce plausible shapes.

I have a meeting with Dr. Daniel tomorrow, and will attempt to clarify a few things that I have been wondering about.


Wednesday, June 22, 2005

No to EM algorithm for computing Gaussian mixtures in background modeling

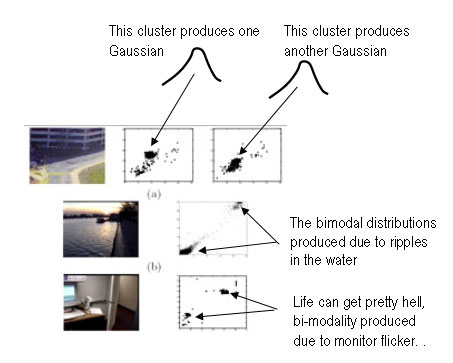
The mixture of Gaussians becomes necessary for modelling the background pixels, owing to the multi-modal distribution of pixel values that can occur in scenes recorded over time. Below are some examples taken from Stauffer. C. et al. paper, where he illustrates the red and green values of a certain pixel, taken from a scene viewed over time. Note the bi-modal distribution of the pixel's values. These images are taken from Stauffer et. al. "Adaptive background mixture models for real-time tracking"


So now the question: given that we have these clusters of data sets, how do we come up with the Gaussian distributions? Normally, we would use the EM (Expectation maximization) algorithm to estimate the values of mu and sigma. A great tutorial/slides on EM can be found here.

EM achieves accuracy and "wraps" properly around the clusters after a number of iterations. In background modeling, each pixel is modeled as a mixture of gaussians. Hence, performing the EM on each pixel is a costly process, owing to the complexity of the EM algorithm. Stauffer et. al. suggests using an alternative approach as described in their paper "Adaptive background mixture models for real-time tracking". More on this, later.

Saturday, June 11, 2005

The implementation of the GaussianModeler

Implementing the data structure for the gaussian modeler required careful thought and consideration. Here my advanced course in java that i took for my M.Sc helped me come up with a good design. For most parts of the system, i want all my components to be loosely coupled. By "loosely coupled" i mean i want all the components to have a great degree of autonomy. In the sense that, if i dont like a component, i can easily replace it with another component, without making major changes to the controller/main code.

I figured that my gaussian model might change in the future, owing to the amount and different conditions that i will experimenting in - a single gaussian background model may not be sufficient.

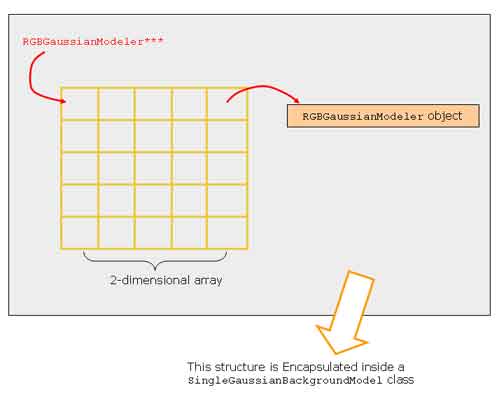
I built a SingleGaussianBackground Model class that encapsulates in itself a structure that is illustrated below:


The RGBGaussianModeler class basically stores every information about the gaussian distribution (mean and standard deviation), and also has methods for updating the Gaussian model, for example adding a red, green or blue color to the distribution, changes the distribution. The RGBGaussianModeler doesnt store a single gaussian distribution, it stores the three separate distributions for all three channels (RGB) of the pixel.

The SingleGaussianBackground is less abstract, in the sense that it has methods that can access a pixel's RGBGaussianModel. It's constructor creates an object out of an array of images of type IplImage - openCVs image type.

Friday, June 10, 2005

Back to the old gaussian model

I was thinking too hard on the background model, and moreover my initial background was seriously flawed. After a series of experiments, I realized that my previous model picked up only the significantly differing colored pixels, as foreground. If you look at the previous posts, you will see that the system's been picking up the purple and yellow balls. I needed it to pick up humans in the scene, which seem to appear in a shade of black and grey from a distance.

My model had a fundamental problem. I had only three gaussian for the background model. One for each of the color channels (R,G and B), hence justifying its ability to properly detect differing colors.

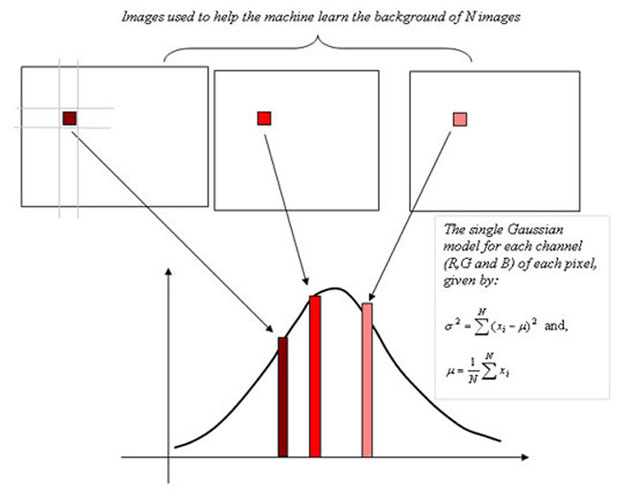
However, this model had to be changed. Any background model should have three gaussian per pixel of the background that is to be learnt by the machine.

Here is an illustration of how this works, the system computes gaussians for each channel of each pixel of the background model


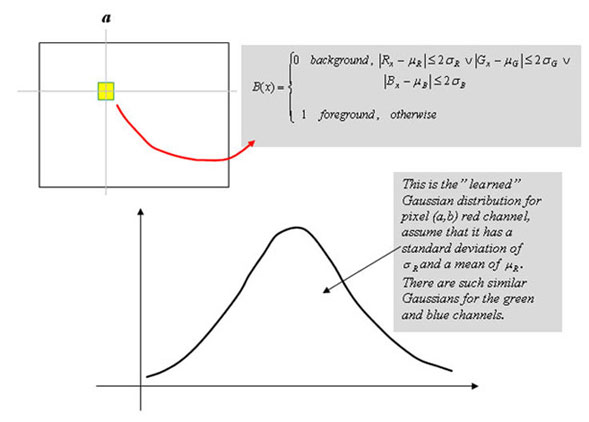
After the background is learnt (i.e. the single gaussians calculated), an image on which background subtraction is applied, undergoes the following tests as illustrated below:

Monday, June 06, 2005

Implementing W4's background model

The simple background that i have implemented doesnt seem to be much useful. However, its a first step to the considerable amount of work that needs to be accomplished to get the background model right.

My background model detector needs to take care of scenes that start out with moving leaves of trees, or if time permits, it should also be able to process and store backgrounds that start off with some moving traffic, etc. The background also needs to update itself recursively, for e.g. there could be an instance where a person could come into the scene and leave an object behind, in which case the object becomes part of the background. Or there could be illumination changes in the scene.

I came across a paper by Haritaoglu et al., titled "W4: Real time surveillance of people and their activities" (published in IEEE transactions on machine intellingence and pattern analysis, August 2000), where they describe a background model that can learn a background even if there are moving objects in the scene (e.g. traffic or leaves), and it can also adapts itself recursively using the so-called "support maps", hence allowing for objects that become part of the background later on.

W4, however, fails when there are sudden changes in illumination, in which case it "thinks" most of the background is the foreground. W4 tries to recover from such catastrophes by using a percentage indicator, i.e. if lets say more than 80% of the background is thought to be the foreground, reject the background model and build a new one immediately.

To begin with implementing W4 into my system, I required a median filter to distinguish between moving and stationary pixels. I am able to use the median filter from Intel's cv library, however, I still need to investigate how it can be used to distinguish moving and non-moving pixels.

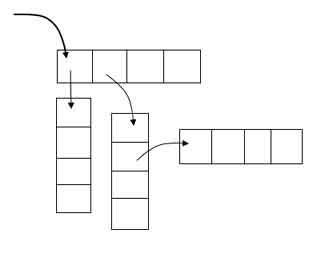
The next step is to store a vector (5 x 1) for each pixel, that is modelled as the background. For this i required a data-structure that looked something like this:


However, when you are trying to implement such a structure in C++, it ends up looking something like this: